Understanding Correlation in Features: A Comprehensive Guide

complete walkthrough onwhat is correlation? why we need to understand it? and How to read the corelation matrix?
In the world of data analysis, the term “correlation” holds significant importance. It’s a statistical concept that helps us understand the relationships between different variables. In this article, we’ll delve into what correlation in features entails, why it’s crucial to check it, and how to interpret a correlation matrix effectively.
What is Correlation?
Correlation refers to the statistical measure of the strength and direction of a linear relationship between two variables. It helps us understand how changes in one variable could impact another. There are different types of correlation measures, with the most common being the Pearson Correlation Coefficient and Spearman’s Rank Correlation.
Pearson Correlation Coefficient
The Pearson Correlation Coefficient quantifies the linear relationship between two continuous variables. It ranges from -1 to 1. A value close to 1 signifies a strong positive correlation, while a value close to -1 indicates a strong negative correlation. A value near 0 suggests a weak or no linear relationship.
Spearman’s Rank Correlation
Spearman’s Rank Correlation assesses the strength and direction of monotonic relationships between variables. Monotonicity implies that as one variable increases, the other either increases or decreases consistently. Unlike the Pearson coefficient, this method works well with ordinal and non-normally distributed data.
Significance of Checking Correlation
Identifying Relationships
Checking correlation helps us identify potential connections between variables. For instance, in a retail dataset, we might observe a positive correlation between advertising expenses and sales revenue, indicating that higher ad spending corresponds to increased sales.
Data Preprocessing
Correlation analysis aids in data preprocessing. When building predictive models, correlated features can be problematic due to multicollinearity. Detecting and addressing these correlations ensures model stability and reliability.
Reducing Multicollinearity
Multicollinearity occurs when two or more independent variables in a regression model are highly correlated. This can lead to unstable coefficient estimates. By identifying and addressing multicollinearity through correlation analysis, we enhance the model’s interpretability.
Interpreting the Correlation Matrix
Correlation Values Range
Correlation coefficients range from -1 to 1. As mentioned earlier, values close to -1 or 1 indicate strong relationships, while values close to 0 signify weak relationships.
Positive vs. Negative Correlation
A positive correlation means that as one variable increases, the other tends to increase as well. In contrast, a negative correlation implies that as one variable increases, the other tends to decrease.
Visualizing Correlation
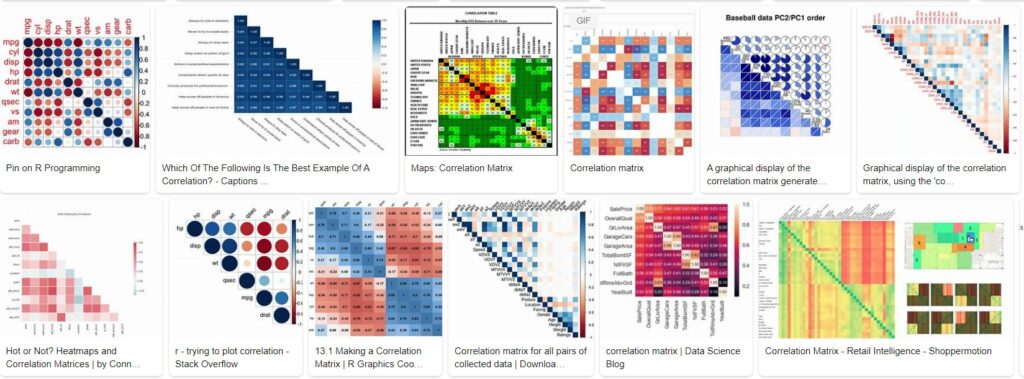
Visualizing correlations using heatmaps provides a clearer picture of relationships. Darker colors represent stronger correlations, while lighter colors indicate weaker ones.

Steps to Read a Correlation Matrix
Arrange Variables
When presented with a correlation matrix, organize variables in a meaningful way. Group related variables together to better understand patterns.
Identify Strong Correlations
Focus on correlation values that are significantly different from zero. Values above 0.7 or below -0.7 usually indicate strong correlations.
Consider Domain Knowledge
Understanding the subject matter aids in meaningful interpretation. A high correlation might make sense logically or align with existing domain knowledge.
Avoiding Common Pitfalls
Confusing Causation with Correlation
It’s crucial to note that correlation doesn’t imply causation. Two variables might be correlated, but that doesn’t mean changes in one directly cause changes in the other.
Overlooking Non-Linear Relationships
Correlation measures only linear relationships. Non-linear relationships might exist but would not be accurately captured by correlation coefficients.
Handling Outliers
Outliers can distort correlation values. It’s important to preprocess data to minimize the impact of outliers.
Correlation vs. Causation
Understanding Causation
Causation implies a direct cause-and-effect relationship. Correlation, on the other hand, merely indicates a potential link between variables.
Correlation as a Starting Point
While correlation doesn’t establish causation, it serves as a valuable starting point for further investigation. It helps us identify variables worth exploring more deeply.
Real-world Applications
Financial Analysis
In finance, correlation assists in diversifying investment portfolios. By understanding how different assets’ prices move in relation to one another, investors can manage risk.
Medical Research
Correlation aids medical researchers in understanding the relationships between various factors and health outcomes. It helps identify potential risk factors and treatment options.
Marketing Strategies
Correlation analysis in marketing reveals which strategies are most effective. For example, it might show whether there’s a correlation between social media engagement and increased sales.
Correlation in Machine Learning
Feature Selection
In machine learning, correlated features can be redundant. By selecting features with low correlation, we enhance model efficiency.
Improving Model Performance
Understanding correlations allows us to design more accurate machine learning models. Including relevant features improves predictive power.
Regularization Techniques
Correlation analysis guides the application of regularization techniques, helping prevent overfitting and enhancing model generalization.
Ethical Considerations
Biased Data and Correlation
Biased data can lead to misleading correlations. It’s important to address bias to ensure fair and accurate results.
Misinterpretation Consequences
Misinterpreting correlations can have serious consequences. Incorrect decisions based on misinterpreted data can lead to undesirable outcomes.
Conclusion
In the world of
data analysis, correlation provides a valuable tool for understanding relationships between variables. While it doesn’t prove causation, it serves as a starting point for further exploration. By checking correlations and interpreting correlation matrices effectively, analysts, researchers, and data scientists can uncover insights that drive informed decision-making.
FAQs
- Is correlation the same as causation?
No, correlation indicates a relationship between variables, but it doesn’t prove that one causes the other. - Can correlation analysis work with categorical data?
While correlation analysis is often used with continuous data, there are methods like point-biserial and phi coefficients for categorical data. - What is the significance of a correlation matrix in machine learning?
A correlation matrix helps identify relationships between features, aiding in feature selection and model optimization. - Are there cases where a high correlation is not meaningful?
Yes, a high correlation might be due to coincidence or external factors. It’s essential to consider domain knowledge. - How does multicollinearity impact regression models?
Multicollinearity makes it difficult to isolate the individual effects of correlated variables, leading to unstable coefficients and reduced model interpretability.


