Time series analysis is a crucial method used in various fields to understand and forecast data points collected over time. Whether it’s financial markets, weather patterns, stock prices, or even social media trends, time series analysis helps us extract valuable insights from temporal data. In this article, we’ll delve into the fundamental concepts of time series analysis, exploring its components, differences from cross-sectional data, and its significant role in decision-making.
Understanding Time Series Data
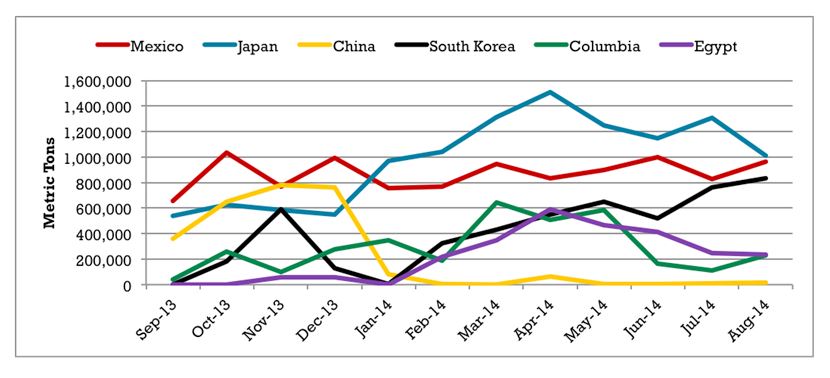
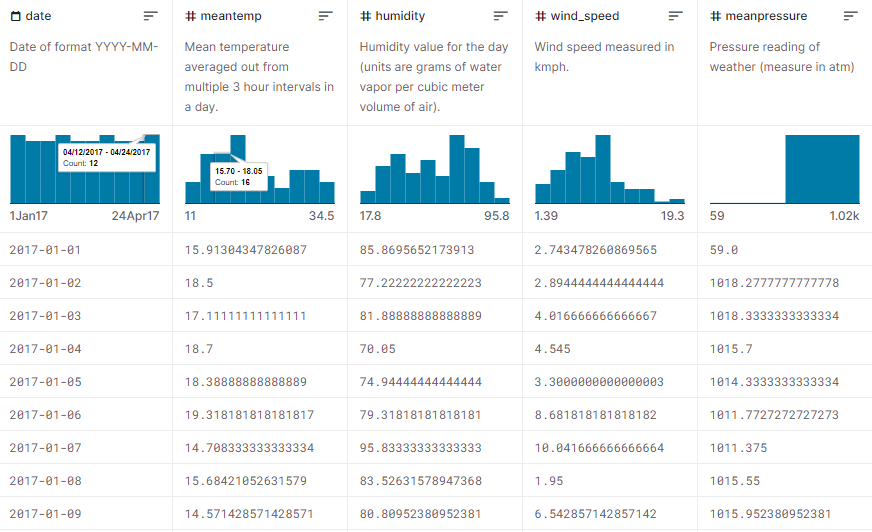
Time series data consists of observations collected at different time intervals. These data points are usually ordered chronologically, making it possible to identify patterns, trends, and recurring behaviors over time. This sequential arrangement helps us analyze the temporal dependencies within the data, enabling us to make predictions about future values.
Components of Time Series
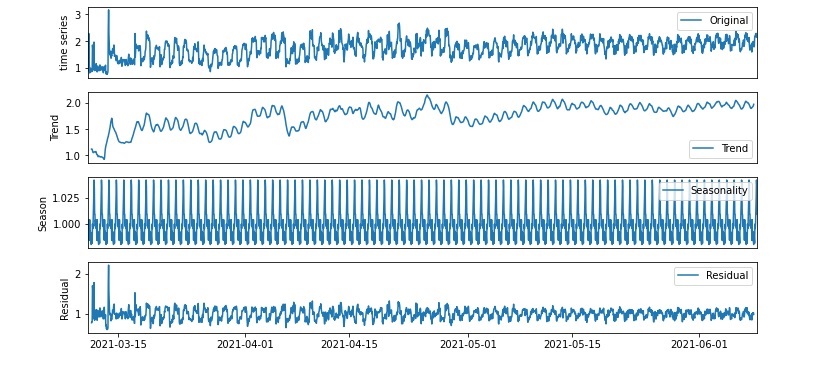
A time series can be broken down into several components, each contributing to the overall behavior of the data:
1. Trend
The trend component represents the long-term movement of the data. It highlights the underlying direction in which the data is moving, whether it’s increasing, decreasing, or remaining relatively stable.
2. Seasonality
Seasonality refers to recurring patterns that occur at specific time intervals, such as daily, weekly, or yearly cycles. Identifying seasonality helps us understand the regular fluctuations in the data.
3. Cyclic Patterns
Cyclic patterns are longer-term undulating behaviors that are not as predictable as seasonality. These patterns often arise due to economic or societal factors and can span irregular time frames.
4. Irregularity (Noise)
Irregular components are random fluctuations that can’t be attributed to the trend, seasonality, or cyclic behavior. They introduce variability into the data and can make predictions more challenging.
Time Series vs. Cross-Sectional Data
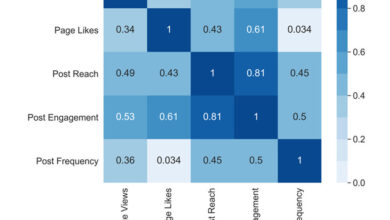
Time series data differs from cross-sectional data in that it is collected over time from a single entity or subject. Cross-sectional data, on the other hand, captures information from multiple subjects at a specific point in time. The distinction lies in the temporal aspect: time series data focuses on tracking changes within a single subject over time, while cross-sectional data analyzes differences among multiple subjects at a single moment.
Importance of Time Series Analysis
Time series analysis holds significant importance across various domains:
1. Forecasting
One of the primary applications of time series analysis is forecasting future values based on historical data patterns. Businesses use this technique to predict demand for products, stock prices, and even financial trends.
2. Decision-Making
Understanding time series data enables informed decision-making. For instance, policymakers can analyze economic indicators over time to formulate effective strategies and policies.
3. Anomaly Detection
Time series analysis helps detect anomalies or outliers in data. This is crucial in fields like cybersecurity, where identifying irregular patterns can indicate potential threats.
4. Trend Identification
By examining the trend component of a time series, analysts can identify long-term movements and make proactive adjustments to strategies.
5. Resource Allocation
Industries such as energy and transportation use time series analysis to allocate resources efficiently. For instance, electricity demand can be forecasted to optimize power generation.
In conclusion, time series analysis is a powerful tool that provides insights into temporal data patterns, enabling us to make predictions, detect anomalies, and inform decision-making. By understanding the components of time series and its distinctions from cross-sectional data, we can harness its potential across various domains.
FAQs
Q1: What is the primary purpose of time series analysis?
Time series analysis is primarily used for forecasting future values based on historical data patterns.
Q2: How does time series data differ from cross-sectional data?
Time series data is collected over time from a single entity, while cross-sectional data captures information from multiple subjects at a specific point in time.
Q3: What are the components of a time series?
A time series has components such as trend, seasonality, cyclic patterns, and irregular fluctuations.
Q4: How can time series analysis benefit the business sector?
Time series analysis helps businesses predict product demand, stock prices, and financial trends, aiding in decision-making and resource allocation.
Q5: Can time series analysis be used for anomaly detection?
Yes, time series analysis is crucial for detecting anomalies or outliers in data, which is valuable in fields like cybersecurity.